Interface Designer: Your guide to designing an interface
Airtable
8 min read

Interface Designer: Your guide to designing an interface
With Airtable, teams can build apps to power their workflows, all working from the same data sources, and all updated in real time.
However, not all collaborators need access to everything in order to take action. An overload of information can confuse and stall your team, instead of driving your campaign, initiative, process, or project forward.
Some good news for you: using Interface Designer, you can create a visual, streamlined front door to your shared data, so collaborators can make decisions based on the most relevant information.
Whether your product team is executing on their roadmap, or your marketing team is managing a global campaign, interfaces present information from your organization’s shared data in a simplified and engaging manner.
By selecting a layout, choosing a table, and customizing interactive components, you can quickly design an interface suitable for a wide range of use-cases and audiences.
Interfaces are perfect for:
- Collaborators who simply need a single place to update the status of projects or add new tasks, but don’t need deeper Airtable access
- Stakeholders who need to review and approve work to unblock their teams
- Leadership and cross-functional partners who require progress updates and summary metrics to drive decision making
Getting started
Where to begin? Start by considering the use case you’re building for.
As a workflow owner, you know each of your stakeholders has different needs. Your creative director might want to approve digital assets, while your C-level executive could need an overview of company-wide goals and progress.
Pro tip
If you’re stumped, try filling in this sentence: I’m building an interface to [insert action] for [list audience]. For example, “I’m building an interface to get creative assets approved by our creative director.”
Create an interface
Now that you know what you’re designing (and for whom), you’re ready to create.
Select the “Interfaces” button at the top of an existing base to view any interfaces you’ve made so far, as well as an option for creating a new interface. If you create multiple interfaces for a single base, you can navigate between them with ease here.
For now, let’s create one new interface.
Selecting “Create a new” takes you to a screen where you can name your interface and then choose a color and logo. The name, logo, and color will be visible for all collaborators you choose to give access to, so be descriptive.
Select “Next'' to choose a layout.
Choose your layout and data
Each workflow is different, which is why Interface Designer offers a variety of layouts to choose from, including table-specific options that help you display lists, galleries, calendar, etc.
Table-specific layouts are a great way to get started quickly since they include predefined elements, meaning you can quickly produce a stellar looking interface for your collaborators.
Ready to add data? Interfaces are built on top of the existing tables in your data layer. After choosing a layout, you’ll be asked to select the table you’d like to connect it to.
If you later decide you want to change the table powering your interface, updating your choice is easy to do. If you’re using a layout that lets you connect more than one table, you can add them after this initial selection step.
Customize your interface
Table layouts
When using a table layout for your interface, you automatically get a design built around best practices that pre-configures things like filtering and search so they automatically work together (unlike the existing layouts option).
You can also customize varying levels of interactivity with table layouts based on what your collaborators will need to support their workflow. This can include simple things like enabling different search and filter options, all the way to letting collaborators edit and add records to the underlying data layer. Explore the properties panel on the right hand side of your new interface to decide exactly what to turn on.
If details are important to your collaborators, you can allow them to see more information by expanding a record, and specify exactly which fields are included.
To provide an even greater level of collaborator flexibility, you can give viewers the ability to change the type of visualization itself.
Whether that means a simple toggle between a list and a calendar, or enabling collaborators to pick from all current table layout options, you control the level of interactivity based on the needs of your team.
Existing layouts
If you’ve opted to use one of the existing layout options for your interface, you’ll have more specific control over each field and element that appears.
Use your mouse to drag-and-drop each component, determining size and position. Click the “Add element” button in the lower-left corner of your screen; this will bring up the menu of every available visual component you can add to your interface.
Some examples of helpful fields to incorporate include the collaborator fields to assign owners, long text fields for description, or attachment fields to show off creative assets. When you add an attachment field, you’ll be given the option to display your images in one of three ways: as a Field, Carousel, or Hero.
Add elements to display your data
In addition to fields, you can add a variety of elements to an interface.
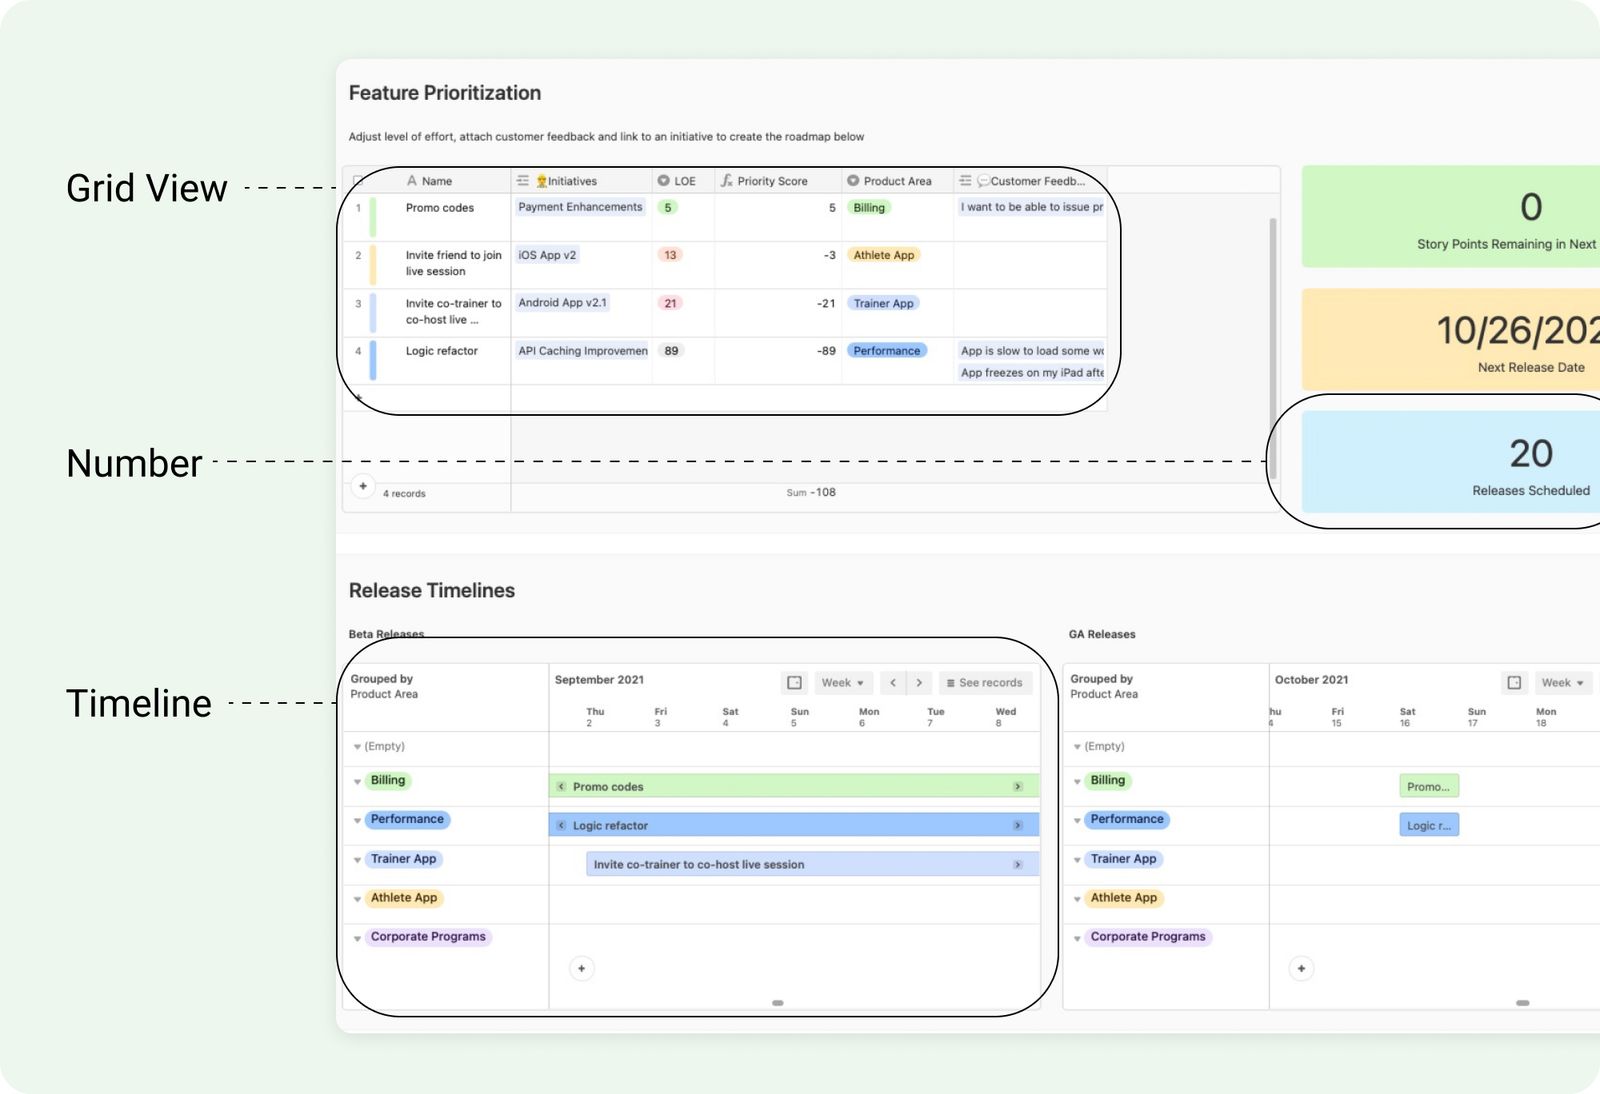
- Grid: Add a table, or multiple tables, from your base with grid elements. We recommend paring down the amount of information with filters to highlight what’s most relevant. You can adjust row height, group, field visibility, and color.
- Number: Keep your eyes on the prize. Numbers display a numerical value, which you can pull from a designated record count or field summary.
- Timeline: Similar to Timeline view, this element displays records over time based on a table’s date fields.
- Chart: Report on key data with a bar, line, scatter, pie, or donut chart.
Design elements to spruce up an interface
- Text: Create a text box to provide context for your collaborators. This is a great way to create section headers, calls to action, and more.
- Divider: Break up fields or big chunks of text with a crisp divider (this is perfect for interfaces that utilize a lot of elements!)
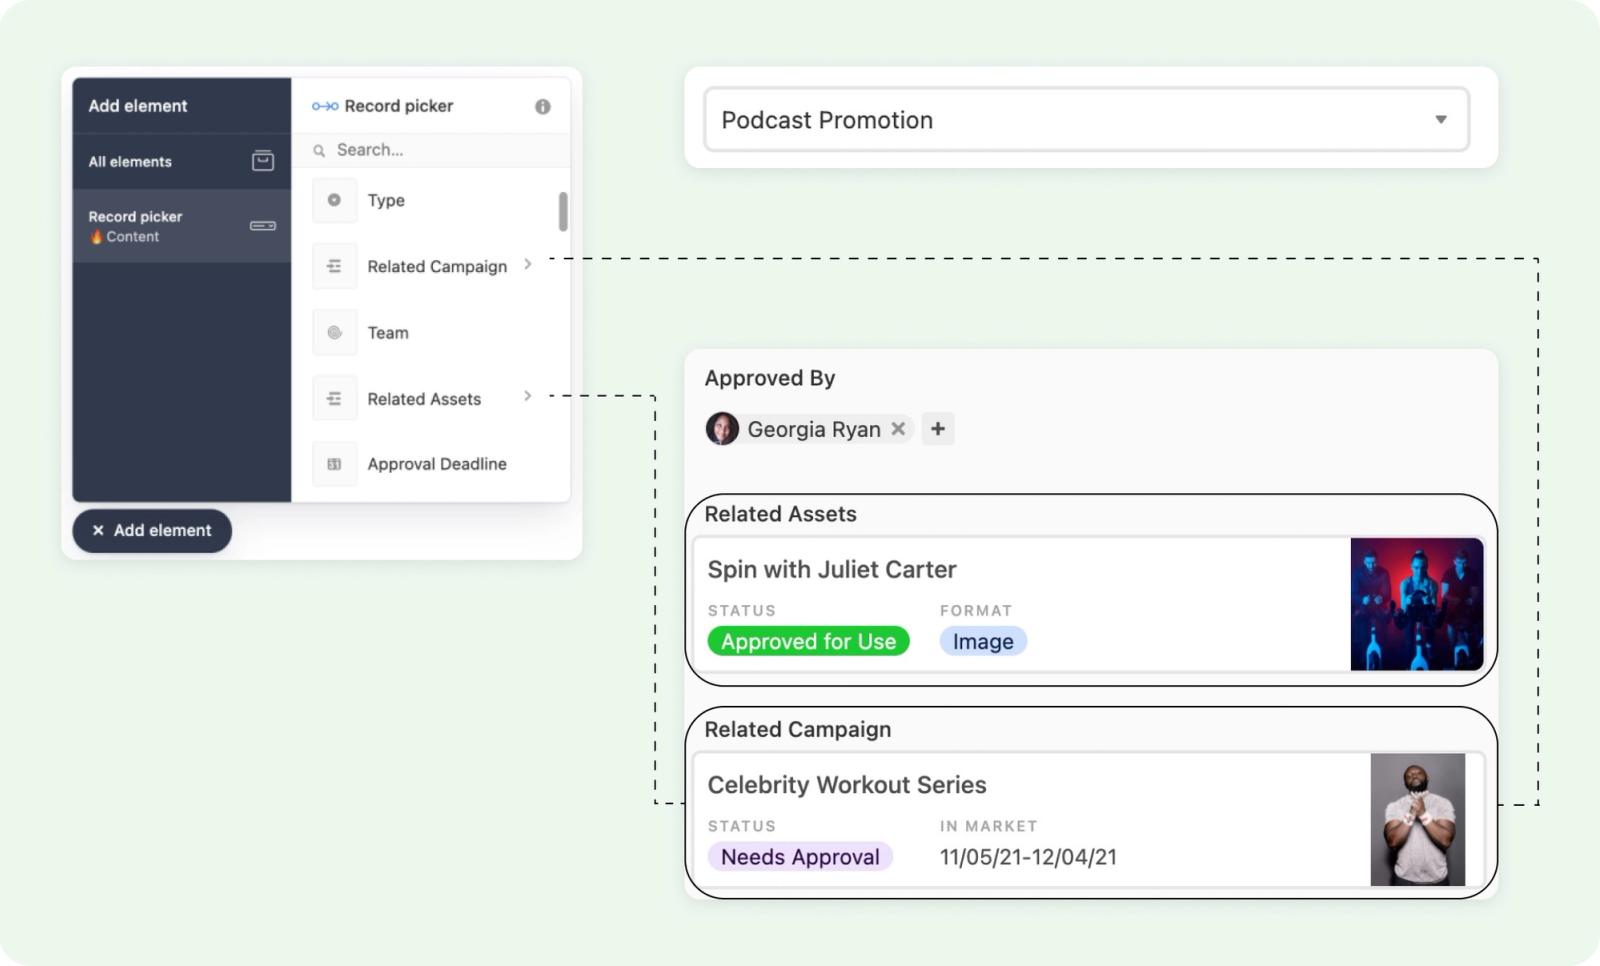
Record picker element
The record picker lets you view one record at a time, along with any associated fields you choose. Use the drop-down menu in the elements panel to choose which fields you want to see associated with the record.
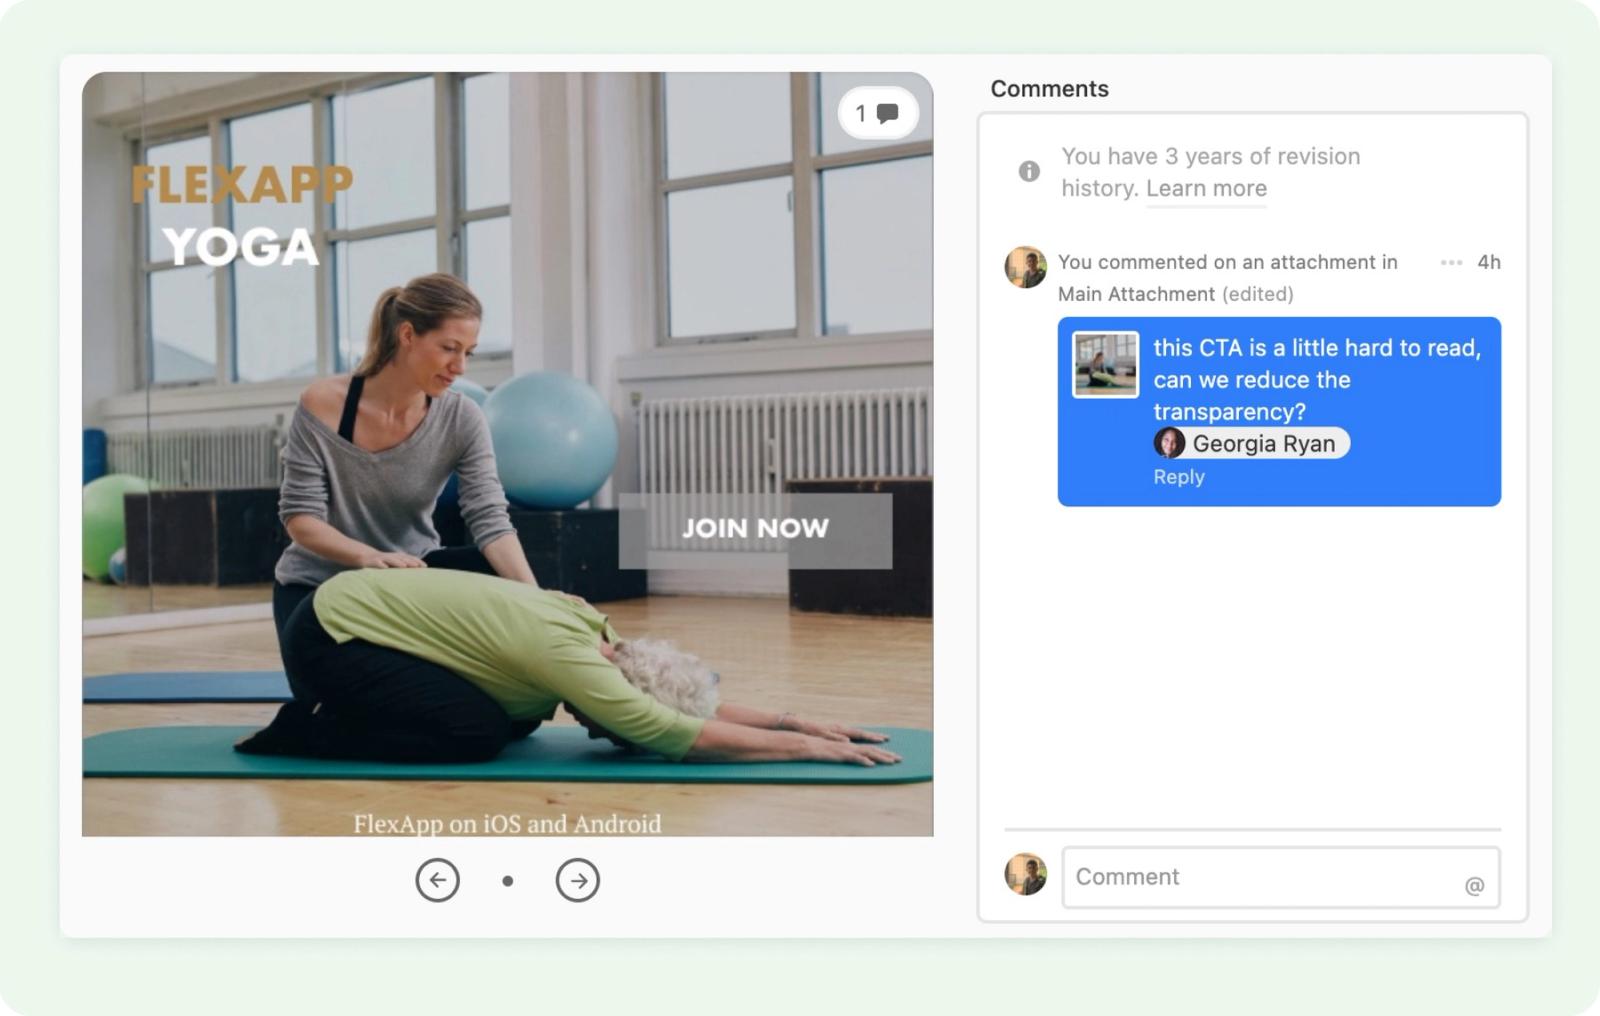
Comment element
Create a space for collaborators to add or view comments on a selected record.
While you’re more than welcome to add as many elements to your interface as you’d like, we recommend choosing only the elements critical to your workflow to avoid information overload. For example, try limiting the number of text boxes in your interface, and cut down on the amount of scrolling needed to view all your information.
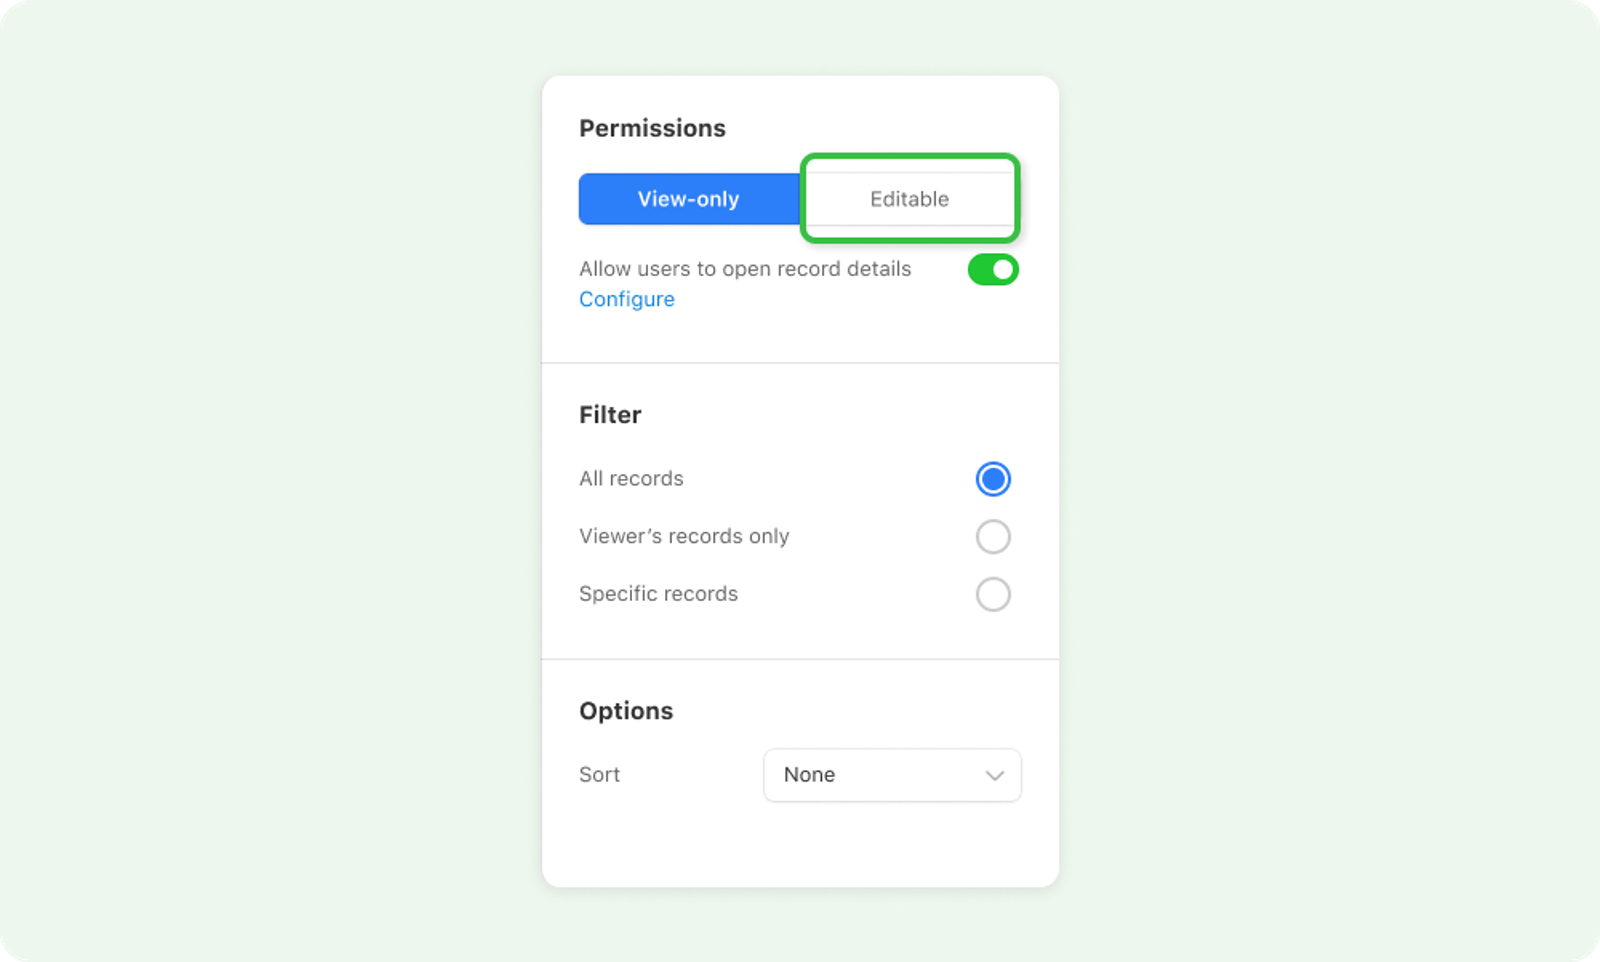
Making elements editable
Clicking some elements will bring up edit access options, letting you classify them as view-only or editable. Editable elements are a great way to make an interface actionable for your collaborators. For example, you may want your collaborators to update the status of a campaign, or assign an owner—in that case, marking the element as “editable” is ideal.
Applying user filters
To apply user filtering, first check that you have an existing collaborator field in the table you added to your interface. If you select “filter by” on the layout or any element that is pulling data from the base, then choose the collaborator field and make it equal to “current user.” This means that when each collaborator views the interface, they will only see the information that is relevant to them.
Pro tip
You can encourage interaction in an interface by assigning unique views to collaborators through user filters. When applied to elements, this filtering allows collaborators to only view the records that have been assigned to them in a base. No need to create dozens and dozens of personal views (insert sigh of relief here).
Preview, publish, and share
Once you’ve added elements and arranged everything to your liking, use the “view as” toggle to see how your interface will look to a specific collaborator. You can also click the preview toggle to see how it will look once published.
When in preview, also be sure to consider how your collaborators will see and use the left hand navigation panel. If you have multiple interfaces created for your app, make sure they are ordered and named in a way that is informative. For example, if you’ve built an app designed to help your product team take customer insight and align it with new features, having interfaces with clear names like “Feedback” and “Roadmap” is a great way to give direction to your collaborators.
You’re now ready to bring your collaborators into your app’s interfaces. Click the share button in the top-right corner of your interface to invite others, either by sending an email or by creating a link.
You have the granular flexibility to decide what level of permission your collaborators should have, and also whether they should also be allowed access to the underlying base.
This is also a great time to think through the previously mentioned user filters capability.
Now that you know exactly who you’ve invited to view your interface, you can create and preview personalized experiences for collaborators right down to the individual element level.
Once you’ve shared your interface with your collaborators, it appears in their Airtable home screen, and becomes discoverable within the base using the “Interfaces” button. If your collaborator already has access to the base, you can also send them a direct link to the interface itself. For a deeper dive into sharing your interfaces with collaborators, be sure to check out our detailed help center article.
That’s a wrap. 🎁You now have a functional, organized interface you can access at any time from your base. You can customize the experience for your collaborators and stakeholders, so they know exactly what you need from them (and dazzle them in the process). And you can create as many unique interfaces as you want—for each workflow, campaign, or whatever else you dream up.
Happy designing!

