Step 6.2: Understand the business impact of your product
Airtable
6 min read

Understand the business impact of your product
One of the most important questions on the mind of product leadership is how the product contributes to the business.
Your company will benefit when you zoom even further out to understand how your product initiatives are tangibly driving positive business outcomes, such as customer satisfaction, influenced revenue, and more. After all, the mission of product teams is ultimately to grow the business by delivering amazing products and experiences that customers love.
To measure the product’s impact on your business in Airtable, there are a couple of ways we recommend aggregating metrics: by feature, and across your organization.
Understand insights for a specific feature
In previous stages, we looked at how to track progress and relevant assets for a given project or feature.
Let’s go back to the “Projects” table, where you can now implement the following best practices to create a holistic picture of feature awareness, customer adoption, and impact:
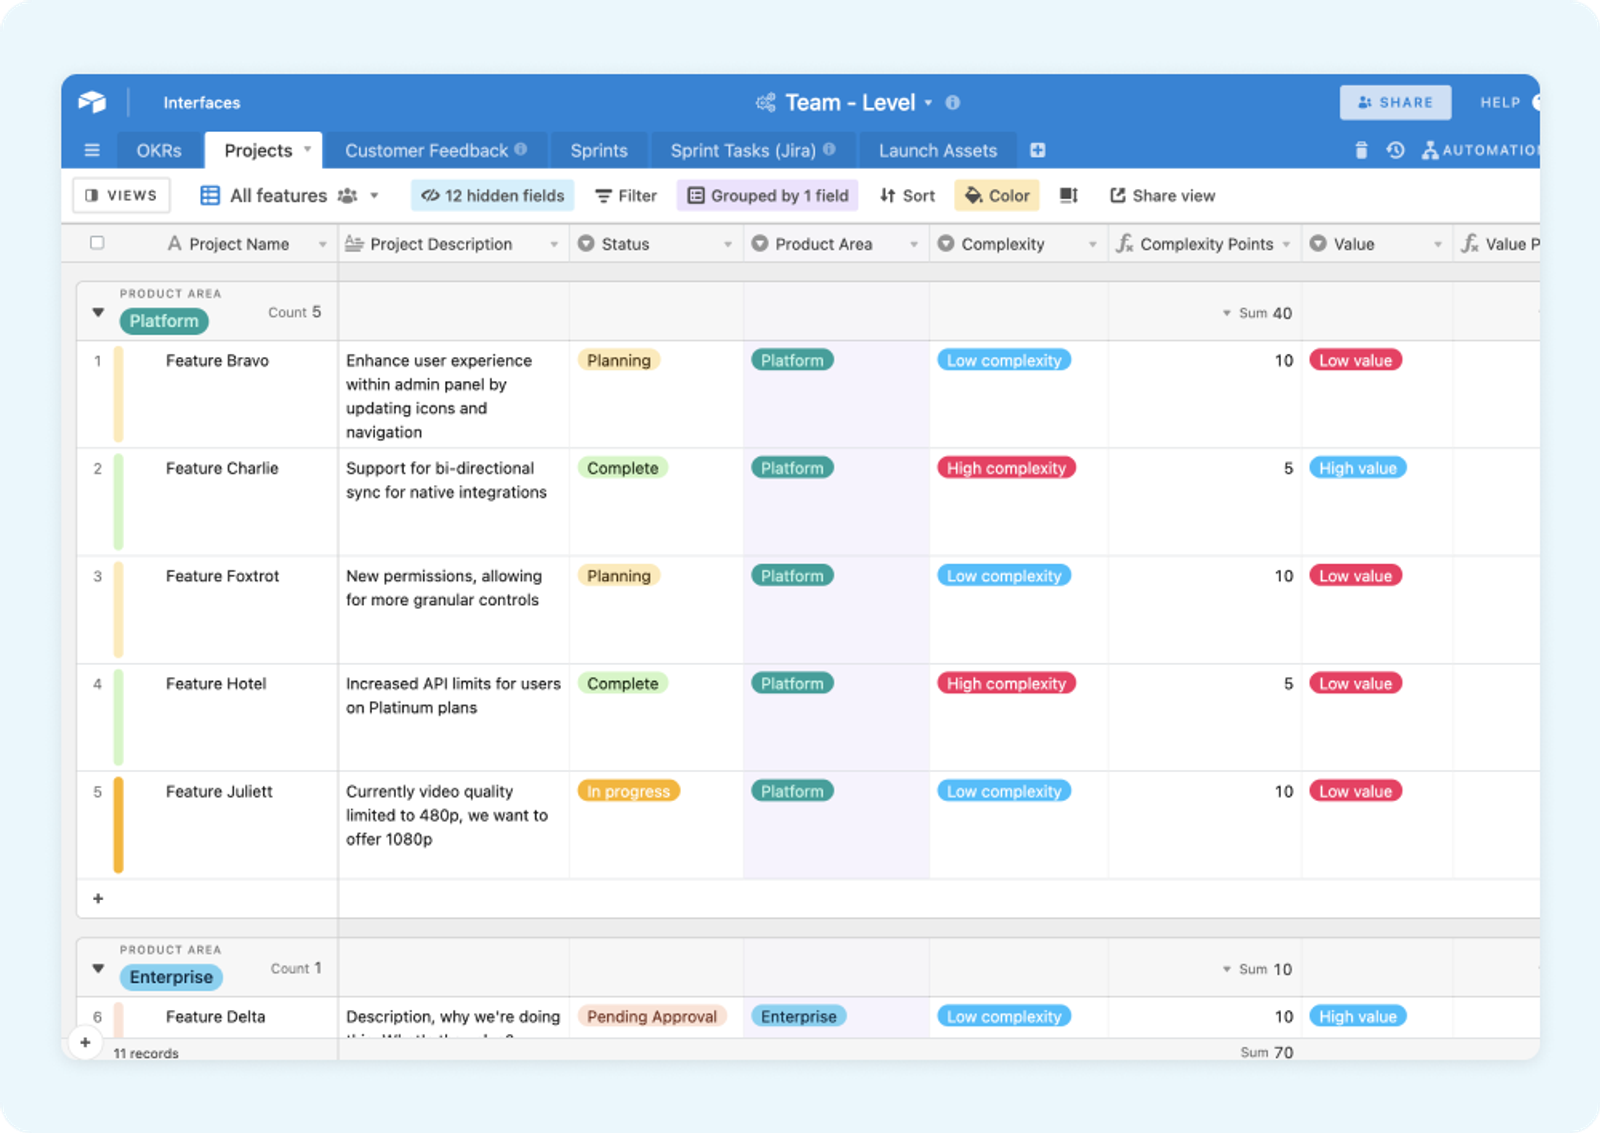
- Integrate adoption insights: To aggregate details like feature adoption, we recommend using our email table sync integration (currently in beta) with any product analytics tool, such as Mode, that can send a CSV file attachment on an ongoing basis. You can pull that data directly into an Airtable table, and link it to the relevant feature/project. Try visualizing this information with a custom interface. Alternatively, you can create a “URL” field and simply embed a relevant URL for a feature adoption dashboard (i.e. Mode, etc.). Note: if you’re interested in the email table sync beta, please reach out to your account representative.
- Understand feature awareness: You can also use the email table sync integration to see the reach of different launch assets—pulling social posts from Hootsuite or email campaigns from Marketo. Import information with email table sync and then link it to the relevant feature/project, or create a URL field with an embed of the relevant dashboard.
- Understand customer impact: As feedback is associated with projects, you can see which feedback points are addressed for a given feature. This lets you do a count of the number of feedback points addressed, then associate with things like ARR touched. This makes it easy to understand whether we addressed the needs of high-priority customers with the feature launch.
Understand insights across your organization
Teams can create customized, curated experiences to understand insights at any level with the help of Interface Designer. Interfaces help leadership and cross-functional partners to understand progress and results, both in real-time and over time.
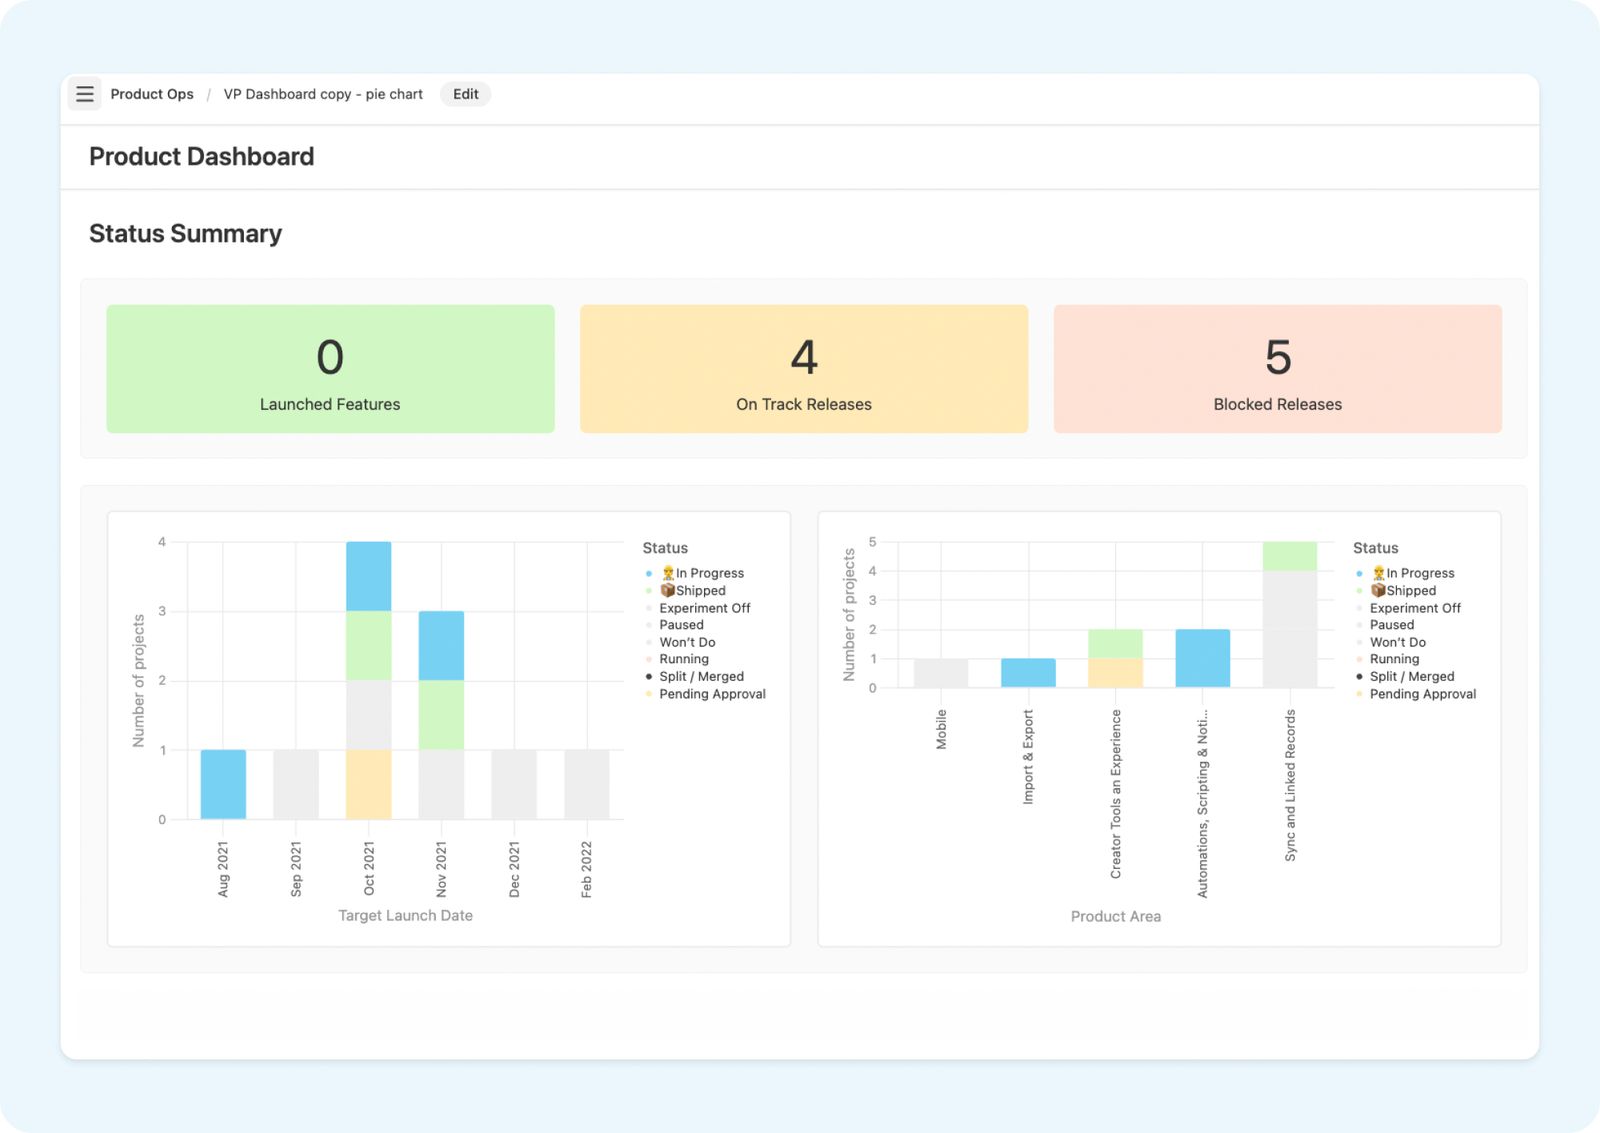
In this interface you can see some of the example insights that can be surfaced in an exec-level dashboard:
- Delivery on customer feedback: We included a grid view element to showcase feedback that we addressed from high-priority customers (in Stage 1) with features delivered across the team.
- NPS over time: We imported data from an NPS tool (learn how to do this in Stage 1) and visualized it within our interface with an embedded chart element. To do this, we included timeframes as well as feedback scores in the import. This allows us to understand how our product releases are impacting customer satisfaction over time.
- Impacted customer ARR: Back in Stage 3, we went through an exercise to prioritize features across the org based on customer and revenue impact. We can now also surface those insights around influenced revenue of the features we delivered.
- Visualize campaigns in flight: As seen in the interface below, we’ve created a roadmap timeline and placed it side by side with upcoming marketing campaigns. This makes it easy to see when feature work coincides with external/customer-facing initiatives to drive awareness and adoption around releases.
With the help of Airtable features like the chart app and interfaces, drawing insights from your product launch is a cinch. And at this stage in the product ops process, you’ll be able to measure and influence metrics like:
- Reduced time manually curating readouts/insights on product org delivery and results
- Understand product execution accuracy and improve estimation
- Understand launch effectiveness
- Increased PM/EPD staff productivity and engagement
- Improve and adapt to changes in process
- CSAT/NPS/Customer Effort Score
- Flexible rollups and insights
Congratulations: you’ve officially reached the end of our product operations guides! (Cue confetti, applause, pats on the back, etc.)
As a quick recap, we’ve shown you ways to collect customer feedback, set OKRs, build a roadmap, build and deliver, manage your launch, and finally, measure and improve your process—all from within Airtable.
When you implement these best practices into your team and/or org’s bases, you’ll find that company-wide alignment is possible, unblocking teams is straightforward, and taking repetitive tasks off everyone’s plates is attainable with automations.
Centralizing your product ops process keeps everyone on the same page so you can work together towards your launch—and then start all over again, this time with even more insight. 💡
Let’s get these products out to your customers, shall we? Sign up here for free, or contact our sales team so we can help your org get started.