Airtable takes a significant step towards its vision

Airtable introduces new ways of viewing, manipulating, and accessing data in Airtable
Airtable introduces new ways of viewing, manipulating, and accessing data in Airtable
When Airtable launched a little over a year ago, we didn’t just set out to build a better spreadsheet. Instead, we aimed to create a fundamentally new medium for working with structured information: a playground equipped with all the building blocks you need to explore and create freely.
With today’s release, we’re taking a big step forward towards that vision. It starts with new ways of viewing, manipulating, and accessing your information in Airtable.
Let’s take a look.
When records get classy
We’re pretty big fans of the grid here at Airtable, but that doesn’t mean Airtable records are trapped within it. Unlike a traditional spreadsheet, an Airtable row represents an individual thing — a project, task, contact, catalog entry, or anything else — and that means you should be able to visualize it in the way that makes the most sense, whether that’s on the grid or not.
With Airtable’s new gallery view, you can display your records as if they were cards on a pinboard — making it easier to visually scan through them, especially when they have image attachments.
If you’ve got multiple attachments in a single field, you can hover over the thumbnail to scroll through them all (without having to expand the record!):
You can even choose which fields show up in the gallery card for a custom browsing experience:
A three-for-one deal
Many of our users have asked for the ability to create reports that sum up their Airtable records in a flexible way. For instance, an executive at Fantastical Records may want to sum up the total revenues generated by each of their label’s albums, grouped by the year of production, and then by the genre of music.
With Airtable, that’s now as easy as clicking the “group” button in any grid view:
Each group gets its own summary bar:
Say goodbye to pivot tables and complicated report builders forever.
But we weren’t just satisfied with building a powerful way to calculate reports. Unlike most other reporting tools, Airtable’s grouped records allows you to directly manipulate and edit the records, not just tally them up. With this feature, you can create fluid project management workflows by simply dragging a record from one stage to another, and editing it inline.
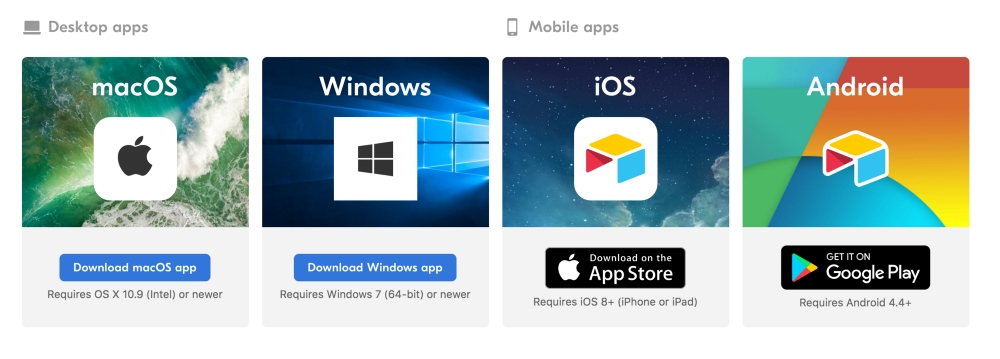
New apps for Windows, Mac, and Android
We’ve still got an iOS app and the web interface for desktop users, but allow us to introduce something new: downloadable apps for Mac and Windows. Oh, and after a year of hard work on the Android app, it’s ready for the entire public to enjoy. Enough said.
A whole new look
You may not have noticed yet, but Airtable just got a brand refresh. We like to think our bright new site reflects the full spectrum of ways Airtable is used, from cataloging rare and endangered plants around the globe to orchestrating every second of an immersive musical. (Yup, they’re both real use cases! Have a fun one to share? Drop us a line!)
We’ve also created a new 2-minute video that you can share with your friends, family, and frenemies alike to explain what exactly Airtable is!
Tools that work for you, not the other way around
Over 2 million bases have now been created by Airtable users, and we’re thankful to you (yes, you!) for being part of this new movement to empower people everywhere to better organize and manipulate the information that matters most to them. We call that information — in whatever form it takes — idiosyncratic data. It’s not big data, it’s not AI, and it won’t deliver you a pizza from a drone, but we believe it’s the next big thing. Here’s to using computers to make us better, and not just the other way around.