Building custom reports in Airtable
Airtable
9 min read

Building custom reports in Airtable
There’s nothing like data—the insights, understanding, and decision-making it unlocks. But “more data” isn’t always the solution.
In fact, sometimes you need to cut things down and simplify to tell the clearest, most accurate story.
In this article, you’ll learn to use Airtable Extensions to easily create custom, visual reports that highlight what’s most important for different stakeholders at different times. With extensions, you can turn your data into a visual report that tells a story in just a few clicks.
Building reports with Airtable Extensions
Using Extensions, you can further visualize and take action on the information in your base. Extensions can be used to create a variety of dashboards or reports, fully customized to your team’s needs.
Extensions are built on top of views; this ensures you’re using the latest data and saves your team time spent working across multiple third-party tools. You can also customize how data is presented, with options to adjust colors, sizing, and more.
Airtable has other ready-to-use extensions for reporting: Summary, Chart, Pivot Table, and Page Designer. Let’s cover how you might use each of these popular extensions for building reports in Airtable:
1. Reporting with Summary
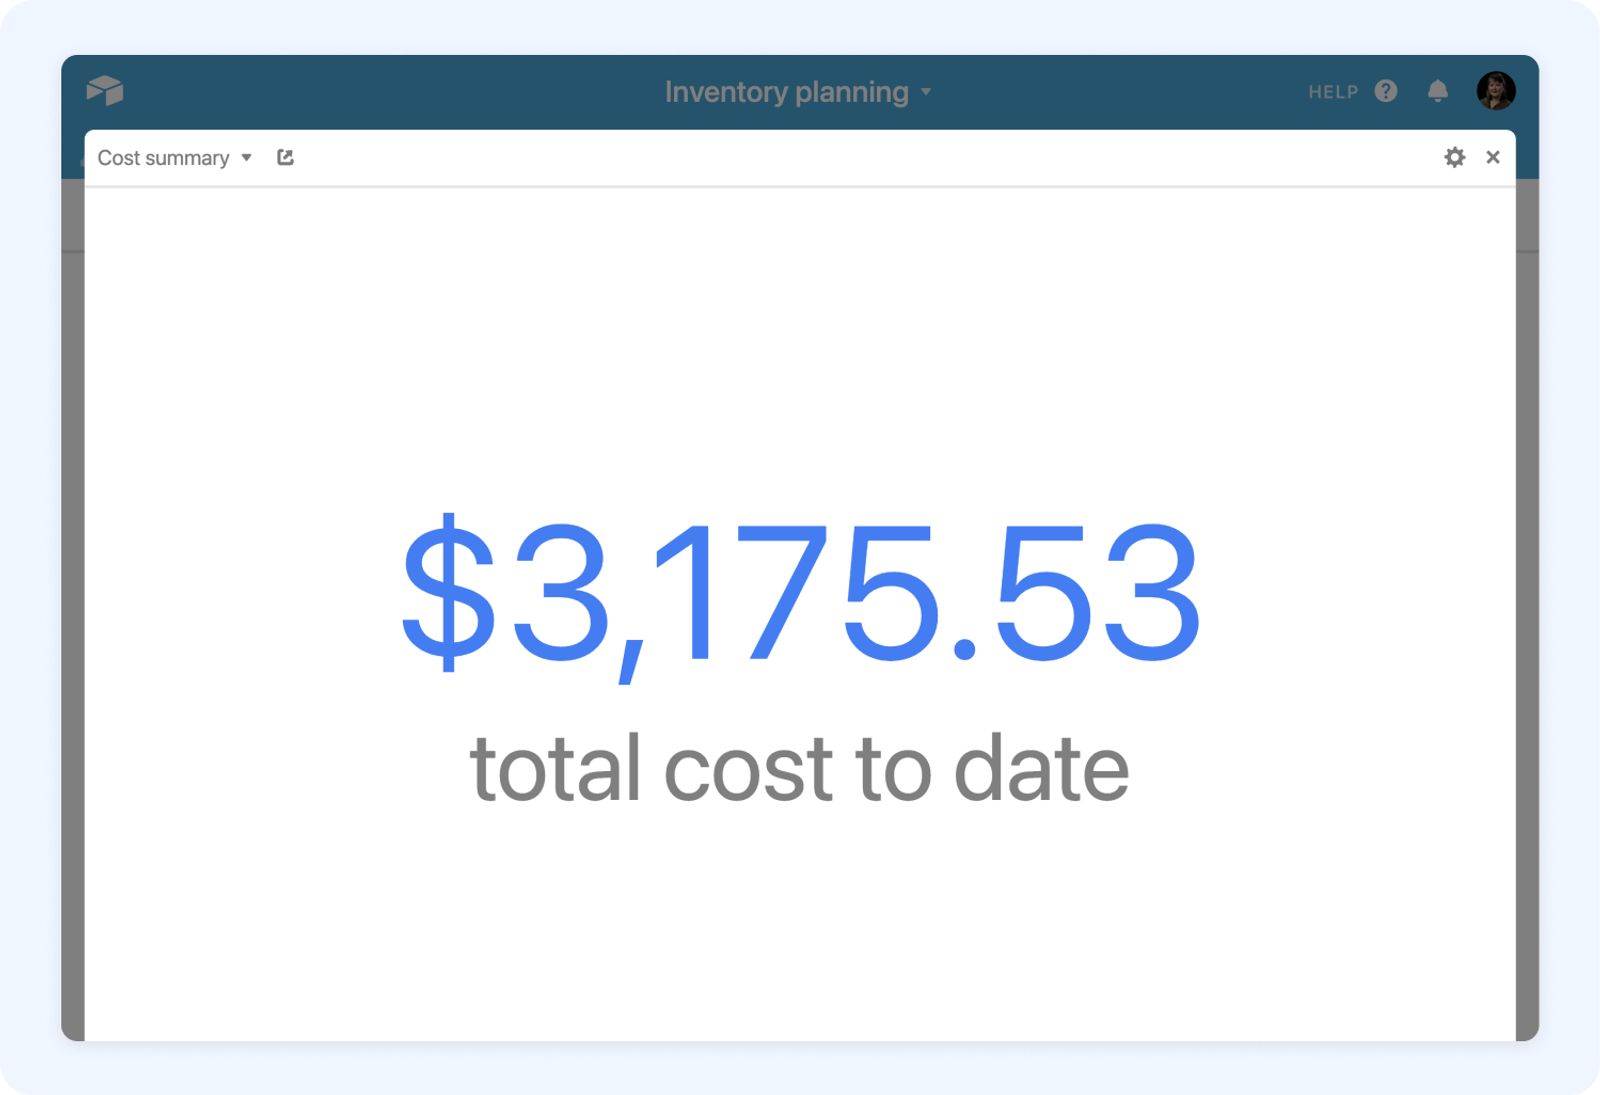
Summary is great for drawing attention to specific values within your report—like number of applicants, total revenue, or inventory counts.
Once you add the extension, select your table and what you want to summarize:
- Count: display the number of records visible—like sales per store, units in stock, etc.
- Calculate: display a sum, average, or maximum value for a specific field. For example, call out a new largest order, the average daily revenue, or keep track of how much money you’ve got left to spend at a glance.
From there, customize your summary by picking a color and adding a label for additional context.
2. Reporting with Chart
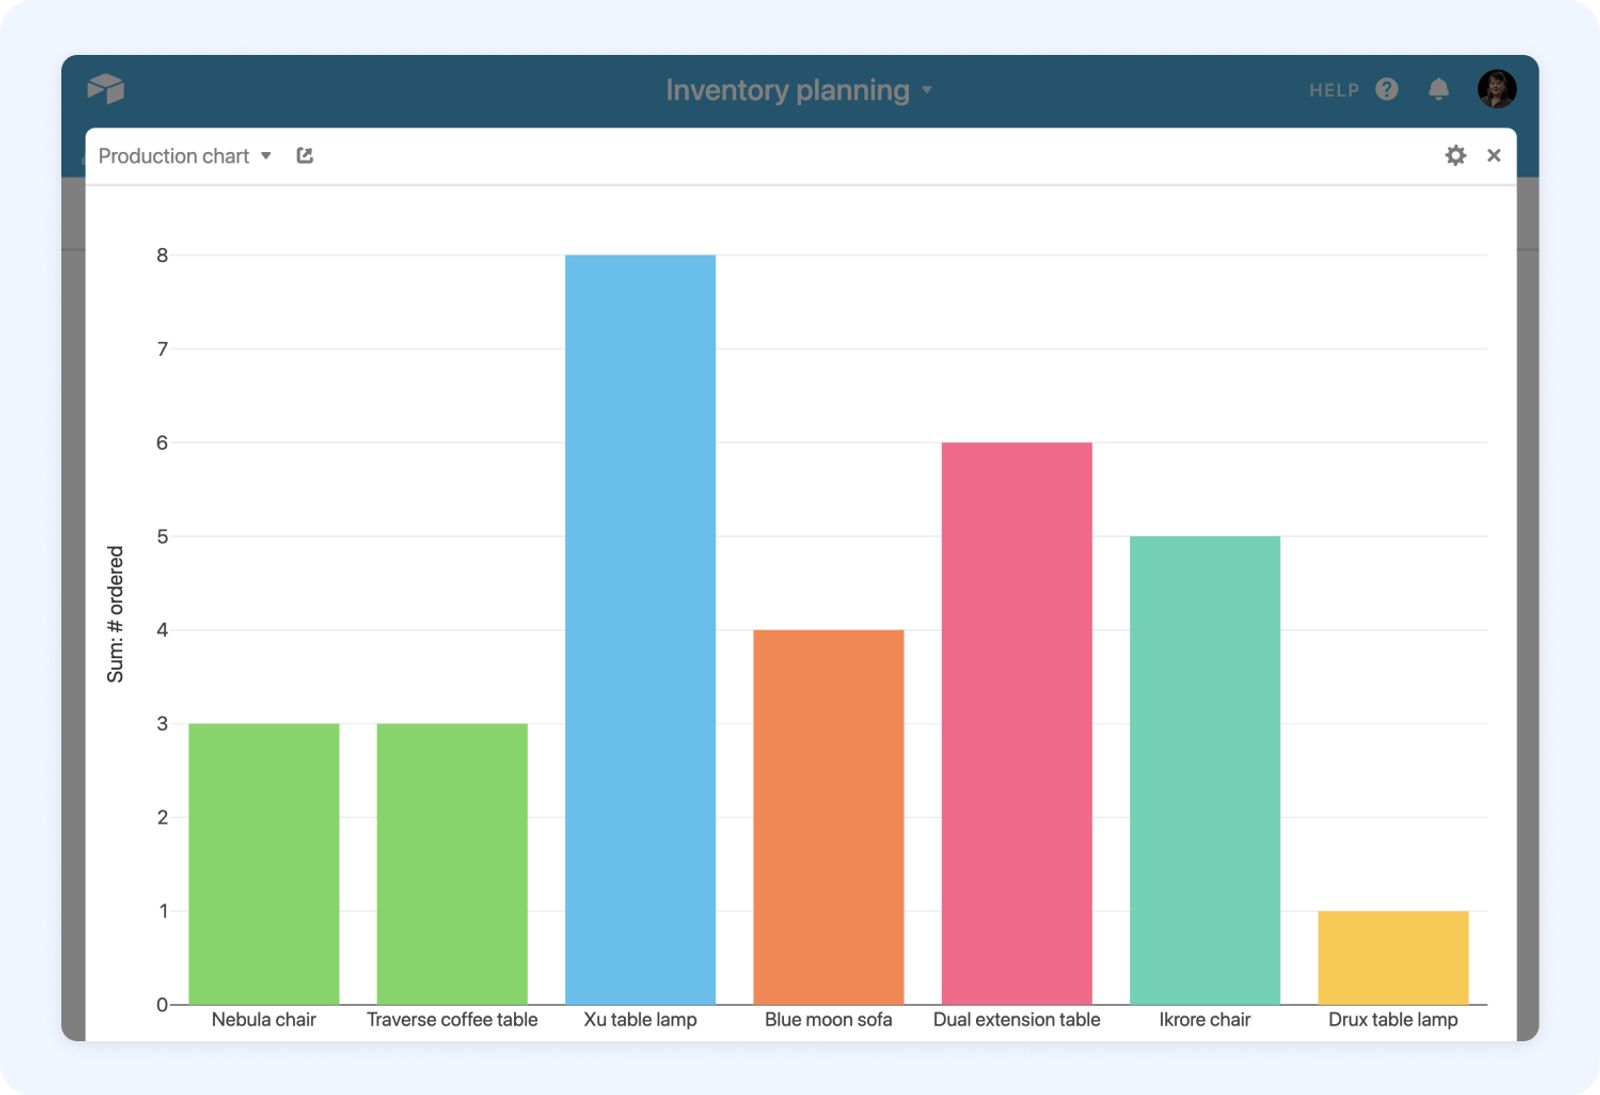
Chart allows you to create bar, line, pie, or donut charts directly in Airtable. Compared to visualizations in the Summary extension, which draw attention to a main value, charts communicate patterns or trends in your data.
The Chart extension has all the functionality you’d expect when it comes to configuring your visualizations. You can define how your data is grouped and displayed, label your data points, and toggle between chart types.
Creating charts directly in Airtable isn’t just more efficient—it also allows stakeholders to get additional context not possible in standard reports. Click on a point or bar in your chart to bring up relevant record(s) and get more information—all from the same tool.
3. Reporting with Pivot table
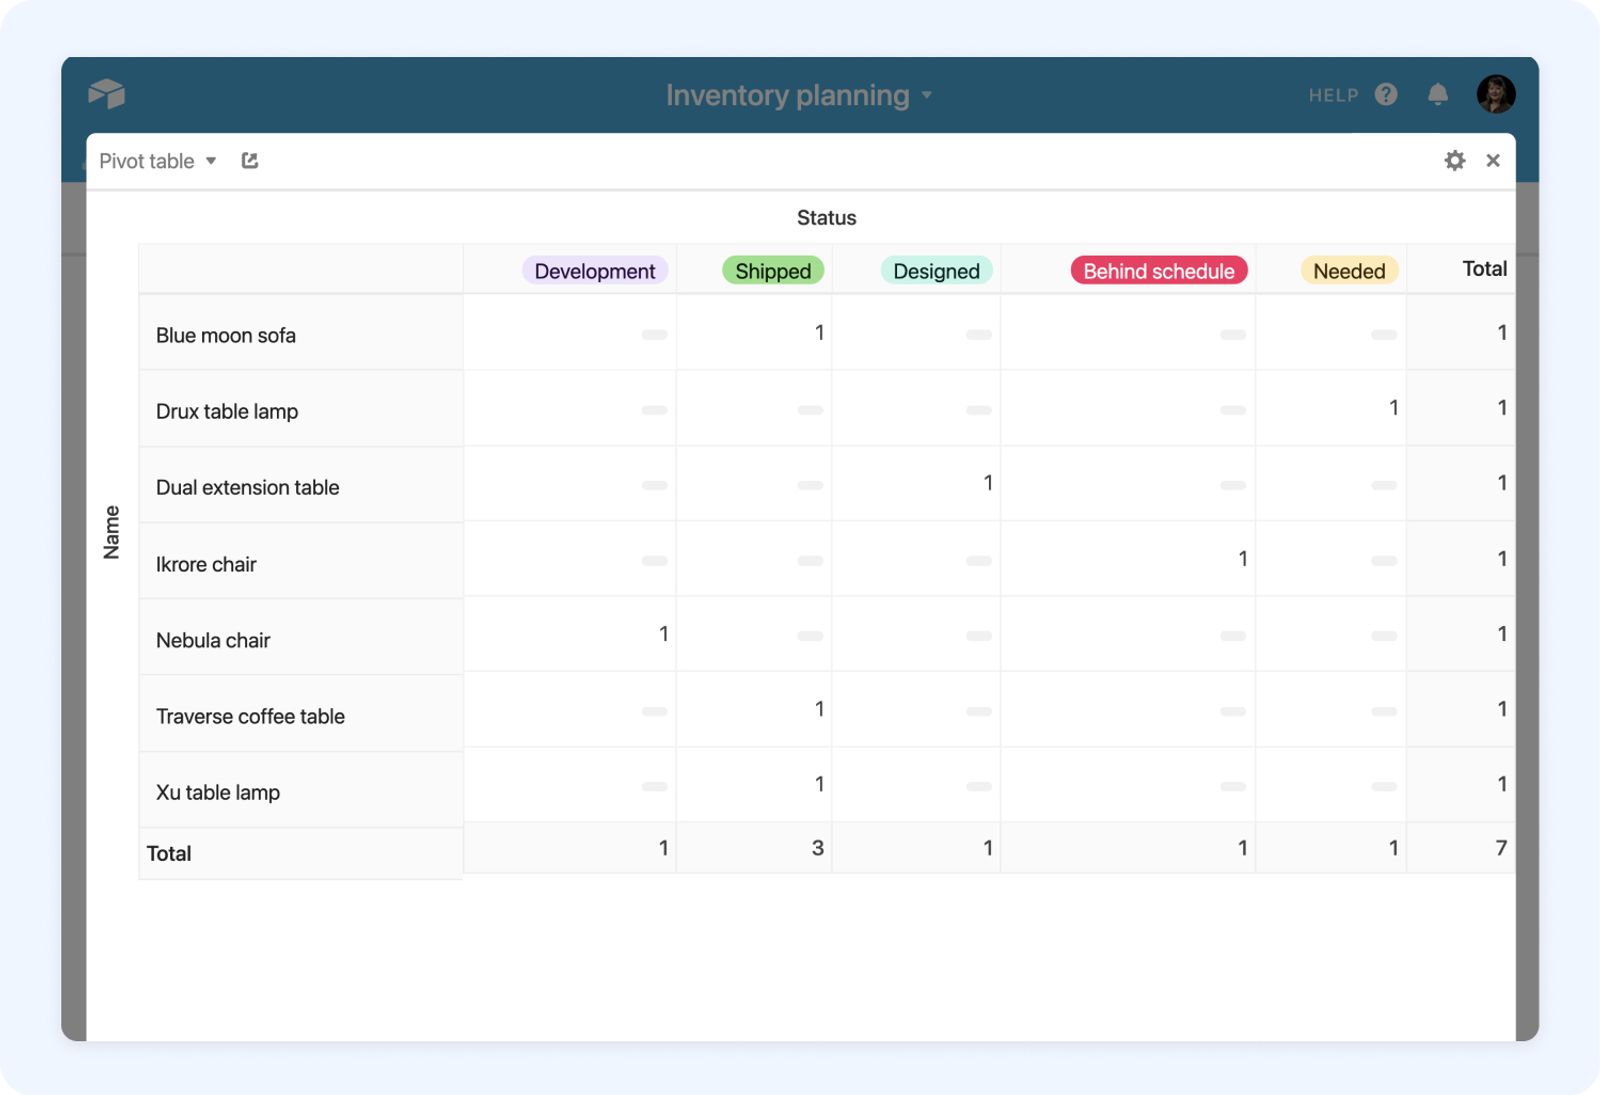
Further summarize your data by grouping information together in meaningful ways. Pivot tables allow you to slice and dice your data to view it in different perspectives.
Pivot tables are especially helpful when you want to compare subsets of data or identify trends. For example, use a pivot table to understand which types of furniture are selling best for different room types.
4. Reporting with Page Designer
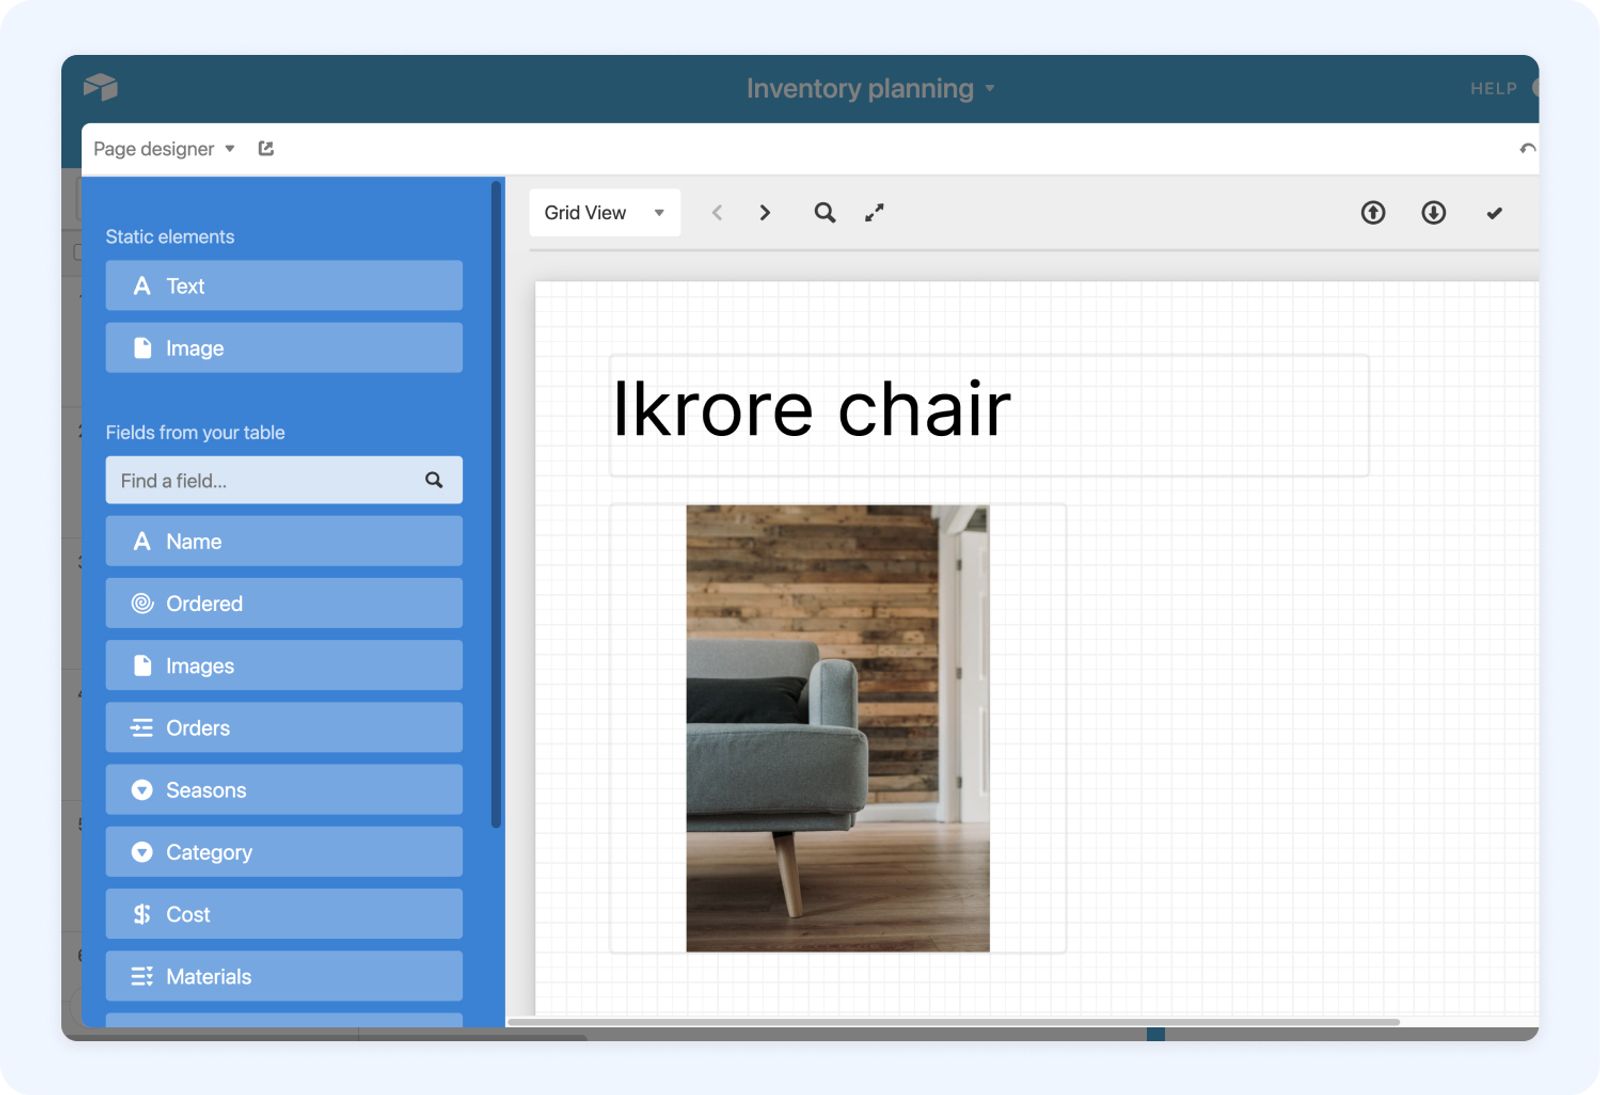
Teams use Page Designer to create everything from meeting decks to exec reports, and from customer-facing invoices to product catalogs. Some teams create designs so polished, they can be embedded directly into their websites.
Page Designer reports are optimized for sharing either in presentation mode, as a PDF, or printed. You can choose the size of the report, add custom branding, and add text to provide more context around your data.
And once you’ve designed the perfect report, save it as a template. After that, you can publish new reports with just a few simple clicks.
Pro tip: Page Designer vs. Interface Designer
While Page Designer is best for designing layouts at a record level, you can create more dynamic displays for collaborators using Interface Designer. Learn more about the differences here.
Organize your extensions in dashboards
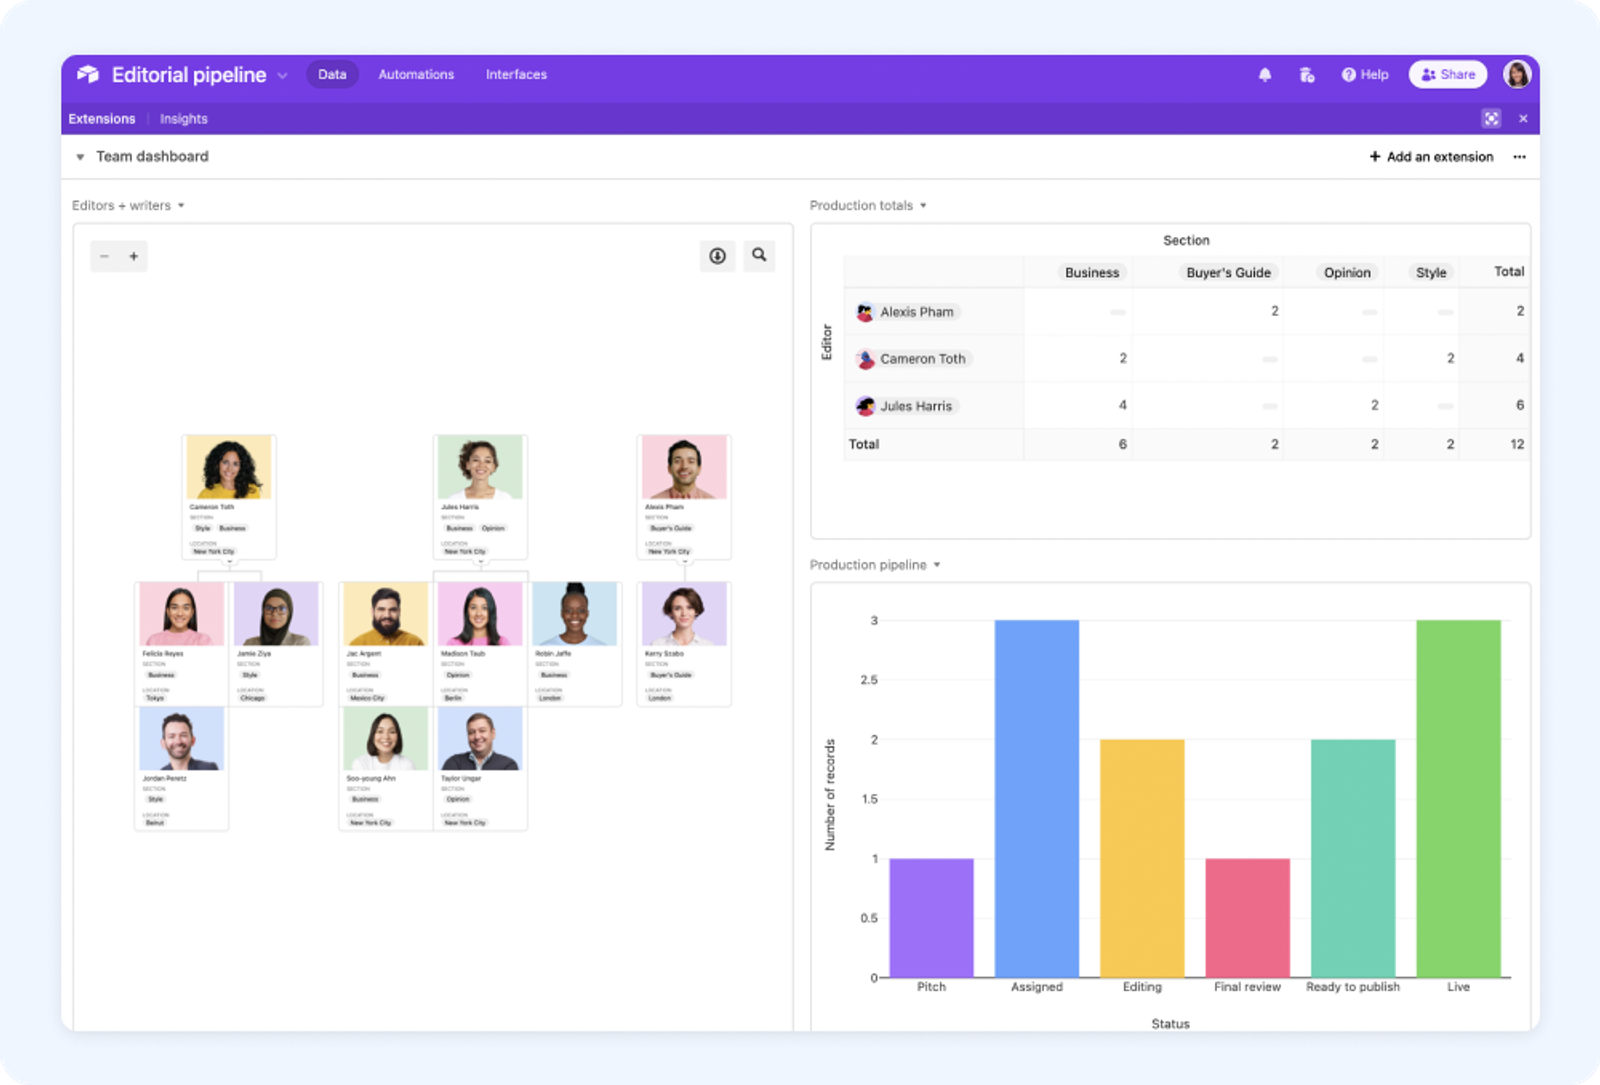
You can combine more than one extension into a single dashboard, giving you multiple high-level views at once.
You can arrange and organize these in a way that makes the most sense for you, and build different dashboards to share with different team members.
Share your reporting extensions
Once you’ve added visuals to your view, you’re ready to share your report. Using permissions, you control who can make edits and who only needs to view the report.
Before you give it a try for yourself, here’s a breakdown of the differences between page designer and the summary, chart, and pivot table extensions in Airtable:
Standalone report, view in Airtable or exportable as a PDF | Built on top of views; requires granting minimum of read-only access to your base |
|---|---|
View detailed information for one record at a time (e.g. customers, product, project) | View information or trends across multiple records at once |
More robust design customization options, including ability to add static images and text | Supports multiple visuals (e.g. summary + chart) in one view |
Additional ways to report in Airtable
Here are two additional ways you can easily report in Airtable:
Use a rollup field
You can use a rollup field to summarize data in any table’s linked records. For example, if you’re publishing a series of stories, you can use a rollup field to determine the last publishing date, so you can easily share when your team is ready to take on a new series.
Check the summary bar
If you’re looking for a summary of the data in any table, check out the summary bar at the bottom of your base. Maybe you want to see how many total records there are in a table or the sum total of your budget field. The summary bar will provide this information at the bottom of any grid view, at a glance.
Try it now: Create a reporting dashboard
Now that you know some of the different ways you can create reports in Airtable, go ahead and try it out for yourself.
You can start by clicking the Extensions icon in any base to open the pane—from there you can explore our Extensions marketplace to select and install the extension of your choice. Then, add a dashboard to display your extensions side-by-side.

If you need additional help, you can view step-by-step directions in our support center.